Revenue tells you how busy you were. Job-level margin tells you whether the work was worth it.
JobNimbus holds plenty of data, yet the default reports don’t always answer what you want to know. Which lead source pays off? Which rep closes? Which job type makes money?
We build reports and dashboards that show lead sources, sales by rep, job profitability and crew utilization. You get numbers you can base decisions on, instead of a rough feel for how the month went.
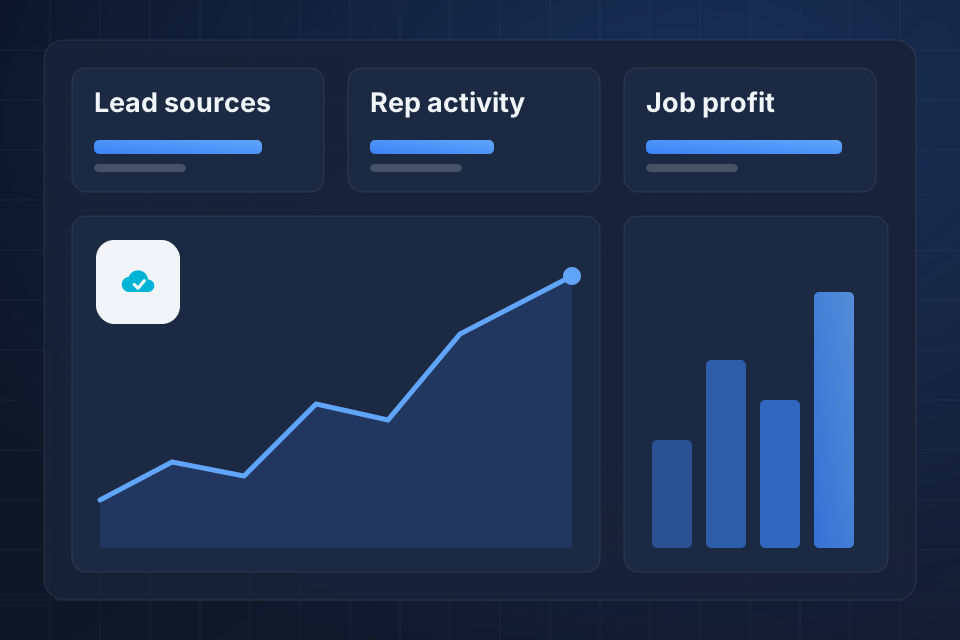
Custom reports for sales, production and profitability
Dashboards for owners, managers and sales reps
Lead source tracking that shows where marketing money works
Scheduled report delivery and alerts
We ask what owners, managers and reps each need to know, then check whether JobNimbus captures that data today.
Job cost reports are only as accurate as the costs captured, so we set up consistent data entry first.
Each role gets its own reports and dashboards, covering close rate, pipeline, gross margin and lead source results.
Reports and alerts arrive on a schedule, and data can flow to Power BI or Looker Studio for deeper analysis.
Yes. We build lead source reports that track cost per lead, close rate and average job value by source. You can then invest in the marketing channels that pay off.
With rep dashboards showing leads assigned, close rate, average job size and pipeline velocity, which is how fast deals move. Used well, these drive coaching conversations and healthy competition.
Yes. For deeper analysis, we build data exports into BI tools, where you can combine JobNimbus data with QuickBooks, ad spend and other sources.
JobNimbus can track job costs if the data is entered consistently. We build reports showing gross margin by job type, rep and service line. Accuracy depends on how well costs are captured, and setting that up is part of the work.
Tell us about your project and we'll get back to you within 24 hours.