You probably have enough data already. What you need is a clear answer to the question in front of you.
Most businesses collect more data than they know what to do with. Reports pile up, and the numbers still don’t tell you what to do next. We help you cut through the noise, build reporting that means something, and turn your data into decisions that actually move your business forward.
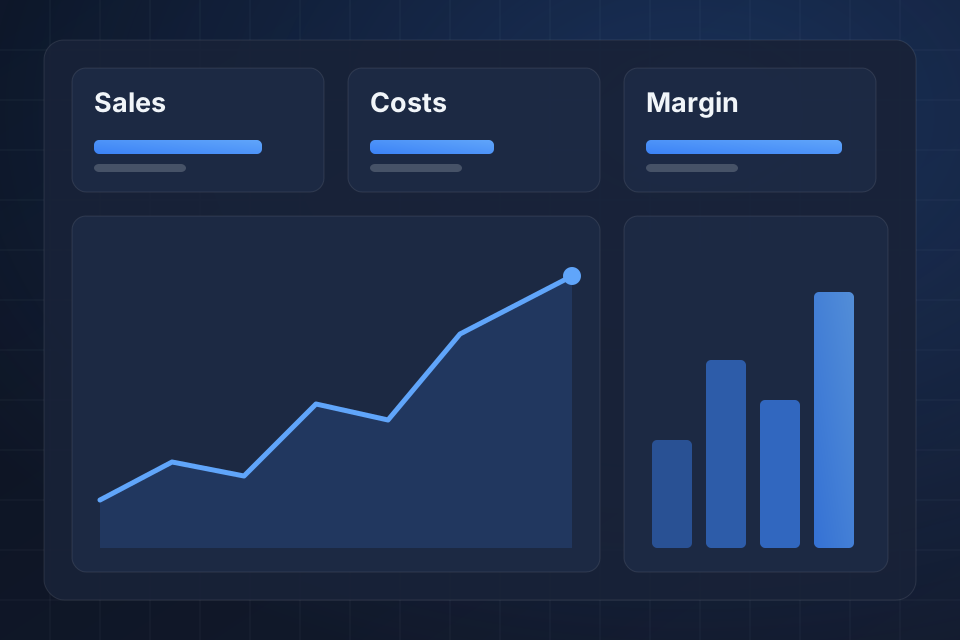
Data without analysis is only a storage cost. Businesses that get ahead know which metrics matter, spot trends before their competitors do, and back decisions with evidence rather than instinct. Good analysis turns the systems you already own into an advantage.
Dashboards, spreadsheets and reports are everywhere, but nobody can tell you what’s actually working. You have plenty of data and very little insight.
Sales data sits in one system, marketing in another and operations in a third. Getting the full picture takes hours of manual work every week.
You track numbers that look good in reports but don’t connect to revenue, retention or growth. Your KPIs aren’t driving the right behavior.
Each team builds its own reports with different definitions, tools and timelines. Nobody has a single source of truth for how the business is doing.
We start with your business questions, then look at the data. We identify the decisions you need to make and work backward to the metrics behind them. Then we build reporting that gets the right information to the right people at the right time.
We pick the measures that matter to your business and connect daily activity to the goals you care about.
Dashboards in Power BI, Looker Studio or your preferred tool that show your team what it needs and leave out the rest.
We combine data from your CRM, online store, marketing tools and ERP into one report, so you see the whole business at once.
Focused answers to specific questions about campaign results, customer behavior, pricing, churn or new market opportunities.
Scheduled reports arrive in your inbox or Slack, so nobody has to log into several platforms every morning.
We teach your team to read and act on data, so analysis becomes something you can do yourselves.
We learn your goals and the decisions data must support, then audit your sources and reports.
Next we define your KPI hierarchy, find data gaps and design reporting that connects metrics to outcomes.
Your data sources get connected, dashboards built, automated reports set up and accuracy checked across systems.
We train your people, document everything and set a review rhythm, so using data becomes a habit.
We don’t sell a business intelligence platform. We’re strategists who understand business operations and know how to make data useful, so we build reporting your people actually use. Dashboards that collect dust don’t help anyone.
Find help for a specific failure in your current systems.
Sales and finance both report revenue, but the totals disagree and nobody can explain the gap. Definitions, dates or query errors may be mixed together. We trace sample transactions, confirm what each number is for and reconcile differences with evidence.
See how we helpProducts look profitable because the report leaves out refunds, delivery costs or selling fees, so your decisions rest on partial math. We find the costs you have, apply your approved margin definition and show allocations and missing costs clearly.
See how we helpYour dashboard loads normally, but figures stopped updating. A page timestamp may make them look current even after a failed refresh. We trace the data path and show its age, so staff can tell a recent page from recent data.
See how we helpTell us about your project and we'll get back to you within 24 hours.