Departments publish different totals
Sales and finance publish different totals under the same revenue label. Both reports may add up on their own while describing different amounts, so your staff can't tell whether the gap is an error.
Data analysis & dashboards
Sales and finance both report revenue, but the totals disagree and nobody can explain the gap. Definitions, dates or query errors may be mixed together. We trace sample transactions, confirm what each number is for and reconcile differences with evidence.
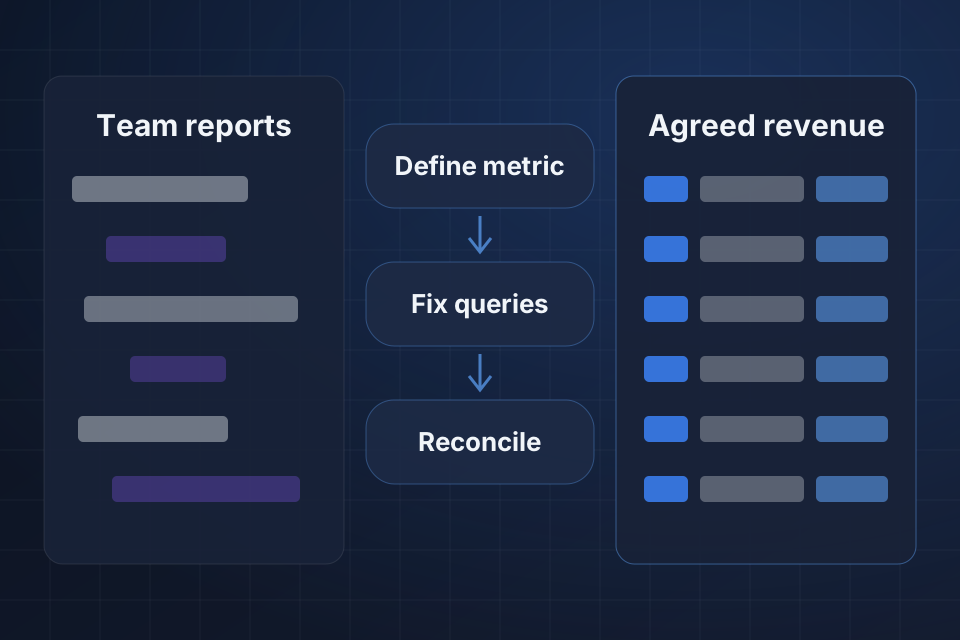
Discuss this problemThe owners of each report first explain what their totals are meant to include. Tax, shipping, discounts, refunds and recognition dates can create valid gaps, while filters or joins (the way data tables get combined) can add errors. We follow the same transactions, with private details removed, through both reports. We also check how current the data is, along with time zones and currencies. The definitions you approve then guide any query fix. A reconciliation view lines up the two totals and explains the gaps that remain. That gives your teams a comparison someone maintains, in place of another unexplained monthly spreadsheet fix.
Sales and finance publish different totals under the same revenue label. Both reports may add up on their own while describing different amounts, so your staff can't tell whether the gap is an error.
The gap shifts between periods because refunds or date cutoffs move transactions differently. A small mismatch seems to grow or shrink, with nothing tying the change to the records behind it.
Staff adjust a spreadsheet every month to compare the reports. Only the person who keeps that file knows which gaps are expected and which deserve a closer look as possible errors in the math.
With each report's owner, we write down how that measure treats tax, shipping, discounts and refunds. Finance approves accounting definitions, while sales can keep a separate day-to-day measure with a clear name.
We follow sample transactions through both reports and compare their dates and the amounts included. Checking each record this way separates intended gaps from unexpected ones caused by filters, joins or data conversion.
Before comparing final totals, we review period boundaries, currencies and how current each source is. A stale data extract or a different time zone can explain a gap without either department changing its definition.
We publish the agreed definitions and clear report labels. Your staff can then tell day-to-day sales from the finance-approved revenue view before they combine or compare numbers that answer different questions.
We correct verified query or data conversion errors against the approved definition. Then we check the changed joins, filters or date logic with the same sample transactions that first showed the gap.
We create a reconciliation view for valid remaining gaps and for exceptions you can review. Each meaningful gap ties back to transaction evidence or timing, not to an unexplained balancing figure added outside the reports.
Not necessarily, because departments may have good reason to use different measures. We document each purpose and reconcile the two, so a shared label does not hide the distinction. Identical totals make sense only when the approved definitions, periods and data coverage are truly the same.
No. Finance approves the accounting definition and the recognition rules that apply. We set up the data treatment and explain its effect. A sales report can keep a separate day-to-day measure, but its name and reconciliation should make that difference clear to the people using it.
Start with the two report names, their periods and filters, plus one transaction that differs, with private details removed. That lets us see what each report actually includes without asking for your whole customer dataset. We scope wider access to your sources after we find the steps that matter.
Share your reporting platforms and the two measures you are comparing. Include one transaction counted differently, with private details removed, plus the report period and filters, so we can see what each report includes and not only the summary totals.
Explore Data Analysis More problems in Data analysis & dashboards
Tell us about your project and we'll get back to you within 24 hours.