Power BI: Data Modeling & DAX

If two reports disagree on revenue, the cause usually sits underneath the charts.

The Engine Behind Reports

Your reports run slowly, totals don’t match, and adding one new measure takes a developer. These problems usually trace back to the data model, the engine behind every Power BI report.

We design star schema data models, a simple layout with one main table joined to smaller lookup tables. Then we write DAX measures that work out your business metrics correctly, from simple totals to time comparisons, dynamic segments and what-if analysis.
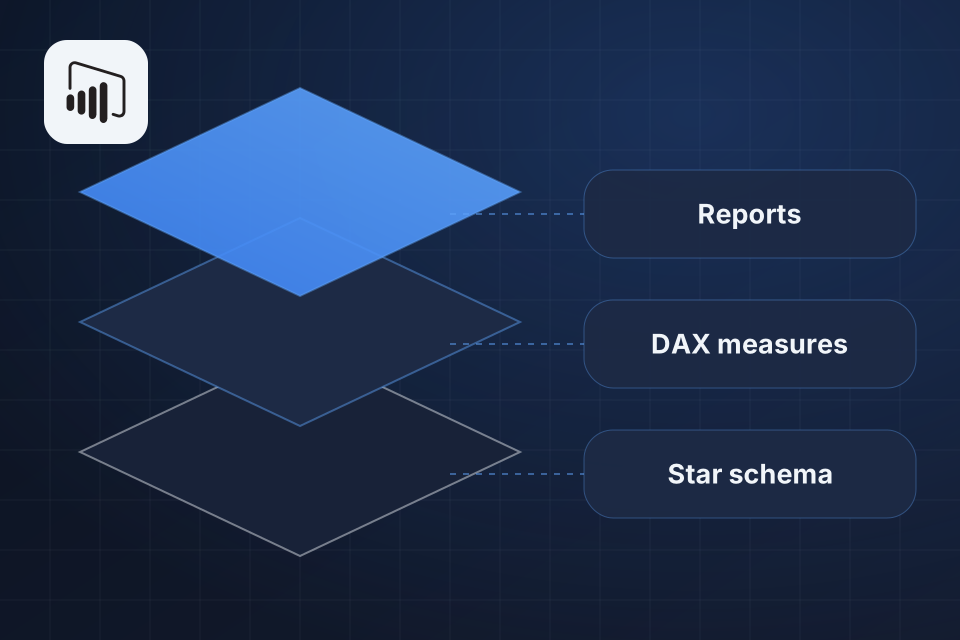
Diagram of a Power BI data model in layers: reports on top of DAX measures on top of a star schema.

What the Model Gives You

Star schema models built to run fast

Custom DAX measures for complex business metrics

Time comparisons such as year over year, month to date and rolling averages

What-if analysis, with inputs your team can adjust

How We Build Models

1

Map Sources

We map your databases, APIs, Excel files and cloud services, then use Power Query to pull in and shape the data.

2

Design the Schema

We arrange that data into a star schema, with clear links set between tables.

3

Write Measures

We write DAX measures for your metrics, from running totals to cohort analysis, which tracks groups of customers over time.

4

Tune Performance

We cut table sizes, tighten measures and set up incremental refresh, so large datasets stay fast.

Why Choose System Strats

We’ve built Power BI solutions for a range of organizations. Every report depends on its data model, so that is where we put the most care.

Frequently Asked Questions

DAX (Data Analysis Expressions) is Power BI’s formula language. It handles metrics that drag-and-drop can’t express, such as year-over-year growth, running totals and weighted averages.

Yes. Slow reports usually point to data model issues. We put a proper star schema in place, cut table sizes, tune DAX measures and set up incremental refresh, which reloads only new data.

Yes. With proper DAX measures, Power BI handles cohort analysis, customer lifetime value, funnel analysis and other advanced metrics. The key is a data model built to support them.

We build data models that combine databases, APIs, Excel files and cloud services. Power Query pulls in and reshapes the data, and links in the model tie it all together.

Ready to Get Started?

Tell us about your project and we'll get back to you within 24 hours.