Power BI: Dashboard Development

A good dashboard answers the question before the meeting starts. A bad one starts a debate about the numbers.

Dashboards People Actually Use

You have dashboards, but people still ask for the numbers by email. The screens look busy, the answer takes too many clicks to find, and nobody is sure where to look first.

Power BI dashboards only pay off if they answer the right questions and are easy to use. We design and build dashboards with clear visuals and a logical layout, so complex data makes sense to leaders, managers and operations teams alike.
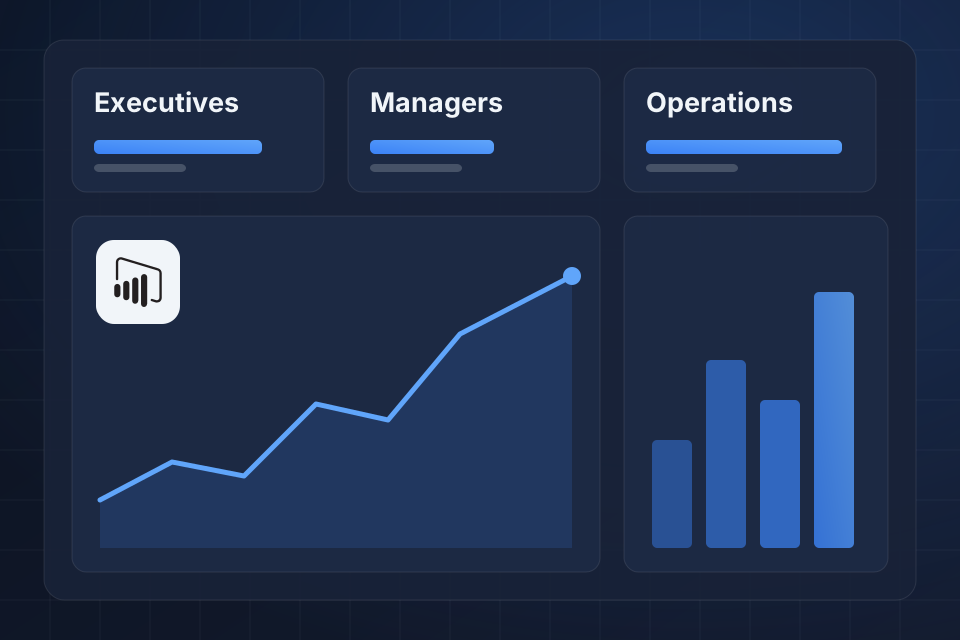
Diagram of a Power BI dashboard with views for executives, managers and operations teams from one data model.

Dashboards You Can Have

Executive KPI dashboards with drill-down paths

Operational dashboards for day-to-day monitoring

Mobile-friendly layouts for checking numbers on the go

Interactive filters and navigation across reports

From Question to Dashboard

1

List Questions

We ask each audience what they need to decide, then turn that into specific questions the dashboard must answer.

2

Plan the Layout

Next come the visual order, chart types and drill-down paths, working from summary down to detail.

3

Build Views

Leaders, managers and analysts each get their own views, all drawn from the same data model.

4

Check and Publish

We check filters, speed and mobile layouts, then publish the dashboards and set up automated refresh.

Why Choose System Strats

We’ve built Power BI solutions for a range of organizations. That experience shows up in dashboards your team can read and act on.

Frequently Asked Questions

It answers specific business questions quickly. We design dashboards with a clear visual order, the right chart types, simple filters and drill-down paths that take people from summary to detail.

Yes. We create dashboards for each role, with summaries for leaders, detailed views for managers and exploratory reports for analysts, all from the same data model.

A single focused dashboard typically takes 1 to 2 weeks. A full analytics project with multiple dashboards, a data model and refresh automation takes 4 to 8 weeks.

Yes. Power BI Embedded lets you place dashboards inside your own applications and portals. We set up embedded reports with proper authentication and row-level security.

Ready to Get Started?

Tell us about your project and we'll get back to you within 24 hours.