Shopify: Conversion Rate Optimization

More traffic won’t help if the store loses people between the product page and the payment step.

Where Your Sales Leak

Your ads and search listings bring people to the store, but too few of them buy. They may drop off at the product page, stall in the cart, or give up at checkout on a phone.

We study how shoppers behave using analytics, heatmaps and session recordings, which show where people click and stop. Then we improve the checkout and page design, and run A/B tests, where two versions compete, to lift your conversion rate step by step.
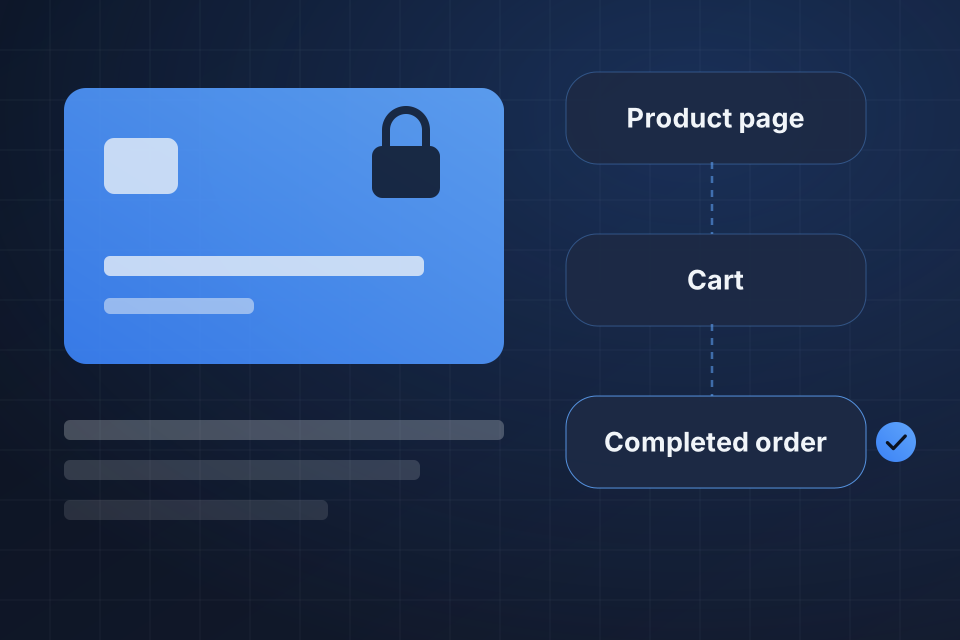
Diagram of the Shopify buying path from product page to cart to completed order, the steps where visitors leave.

What Testing Gives You

A/B tests on product pages, cart and checkout

Heatmap and session recording analysis that shows where shoppers stop

A smoother checkout that reduces abandoned carts

Better conversion for shoppers on phones

How We Test Changes

1

Diagnose

Analytics, heatmaps and session recordings show where shoppers drop off. A checkout funnel audit shows which steps lose them.

2

Prioritize

Problems get ranked by potential impact, so the biggest conversion killers are fixed first.

3

Test

We run A/B tests on layouts, buttons, pricing display and checkout steps until the result is statistically reliable.

4

Roll Out

Winning versions become permanent, and each result shapes what we test next.

Why Choose System Strats

We’ve built Shopify operations for a range of brands. Conversion work sits inside that bigger picture, so a winning test also has to suit how your store runs day to day.

Frequently Asked Questions

It depends on your products, prices and traffic sources. Rather than chase a published average, we measure your store’s current rate and work to raise it. Even a small gain can have a real effect on revenue.

We combine several sources. Your analytics, heatmaps, session recordings and a checkout funnel audit reveal the biggest problems, and industry benchmarks add context. Then we rank the fixes by potential impact.

We test product page layouts, call-to-action buttons, pricing display, checkout changes, trust badge placement and urgency messaging. Every test runs to statistical significance, meaning the result is unlikely to be chance, before we make a change permanent.

Quick wins like checkout and mobile fixes can show results within 2 to 4 weeks. A full program of steady testing typically shows significant cumulative gains over 3 to 6 months.

Ready to Get Started?

Tell us about your project and we'll get back to you within 24 hours.