The data you need is already in Eagle. The hard part is getting it out in a form you can use.
You ask a simple question about sales or margins, and someone has to go pull the numbers by hand. By the time they arrive, you’ve already made the call. Or the report takes so long to run that nobody bothers.
We build custom reports, dashboards and data exports from Eagle. You can then answer questions about sales, inventory, customers and margins without waiting on anyone, using tools your team already knows.
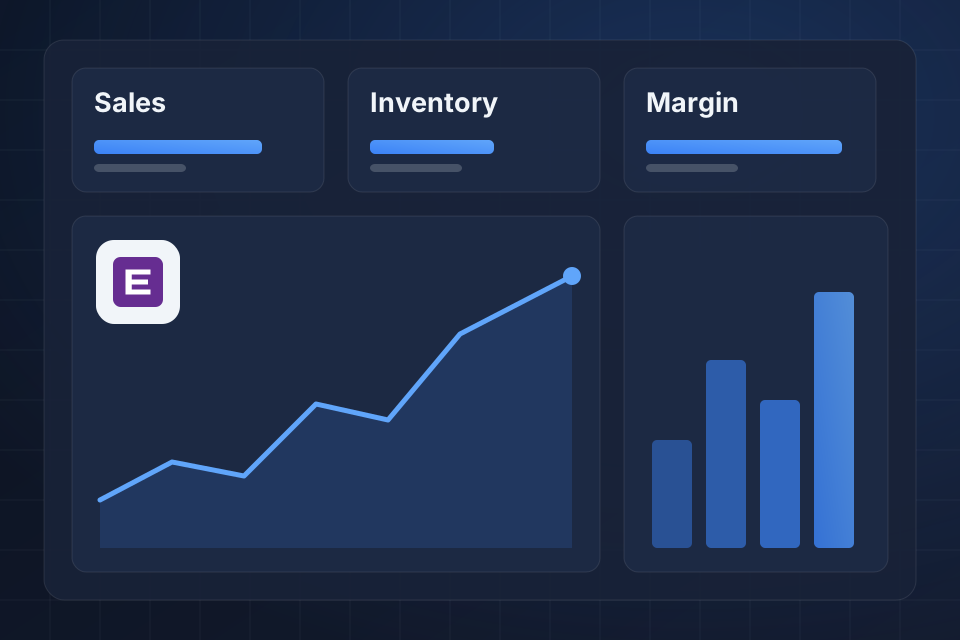
Custom reports built around the questions you actually ask
Scheduled report delivery to the people who need them
Data exports for Power BI, Excel or Google Sheets
Dashboards that bring sales, inventory and margins together
We start with what you need to know about sales, inventory, customers and margins, and who needs it.
Existing reports get reviewed, and we diagnose slow ones, whether the cause is queries, data volume or scheduling.
We build reports and data extracts, accounting for cost layers, promotions and returns where margins matter.
Sales recaps, low-stock alerts and margin reports go out on a set schedule to the right people.
Yes. We build data extracts from Eagle and connect them to tools like Power BI, Looker Studio or Excel. Your team can then analyze the data in the tools it already uses.
Often, yes. Slow reports usually come from query patterns, data volume or scheduling conflicts. We diagnose the cause, then either rebuild the report or schedule it to run off-hours.
Yes. Scheduled reports are one of the most useful things we set up. Sales recaps, low-stock alerts, margin reports and custom KPI summaries can all arrive on a schedule.
Yes. Margin reporting is one of the most common requests from Eagle users. We build reports that account for cost layers, promotions and returns, so the numbers reflect reality.
Tell us about your project and we'll get back to you within 24 hours.